To view this article in 150-dpi PDF, 300-dpi PDF, or 600-dpi PDF, click on the appropriate item in this sentence.
Arthur B. Robinson, Noah E. Robinson, and Willie Soon
Oregon Institute of Science and Medicine, 2251 Dick George Road, Cave Junction, Oregon 97523 [artr@oism.org]
A review of the research literature concerning the environmental consequences of increased levels of atmospheric carbon dioxide leads to the conclusion that increases during the 20th and early 21st centuries have produced no deleterious effects upon Earth's weather and climate. Increased carbon dioxide has, however, markedly increased plant growth. Predictions of harmful climatic effects due to future increases in hydrocarbon use and minor greenhouse gases like CO2 do not conform to current experimental knowledge. The environmental effects of rapid expansion of the nuclear and hydrocarbon energy industries are discussed.
Political leaders gathered in Kyoto, Japan, in December 1997 to consider a world treaty restricting human production of "greenhouse gases," chiefly carbon dioxide (CO2). They feared that CO2 would result in "human-caused global warming" – hypothetical severe increases in Earth's temperatures, with disastrous environmental consequences. During the past 10 years, many political efforts have been made to force worldwide agreement to the Kyoto treaty.
When we reviewed this subject in 1998 (1,2), existing satellite records were short and were centered on a period of changing intermediate temperature trends. Additional experimental data have now been obtained, so better answers to the questions raised by the hypothesis of "human-caused global warming" are now available.
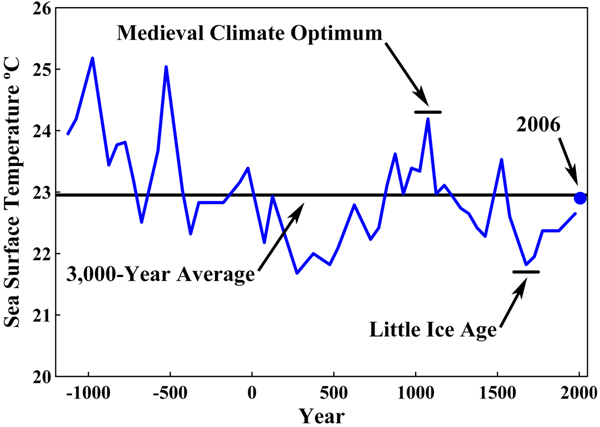
Figure 1: Surface temperatures in the Sargasso Sea, a 2 million square mile region of the Atlantic Ocean, with time resolution of 50 to 100 years and ending in 1975, as determined by isotope ratios of marine organism remains in sediment at the bottom of the sea (3). The horizontal line is the average temperature for this 3,000-year period. The Little Ice Age and Medieval Climate Optimum were naturally occurring, extended intervals of climate departures from the mean. A value of 0.25 °C, which is the change in Sargasso Sea temperature between 1975 and 2006, has been added to the 1975 data in order to provide a 2006 temperature value.
The average temperature of the Earth has varied within a range of about 3°C during the past 3,000 years. It is currently increasing as the Earth recovers from a period that is known as the Little Ice Age, as shown in Figure 1. George Washington and his army were at Valley Forge during the coldest era in 1,500 years, but even then the temperature was only about 1° Centigrade below the 3,000-year average.
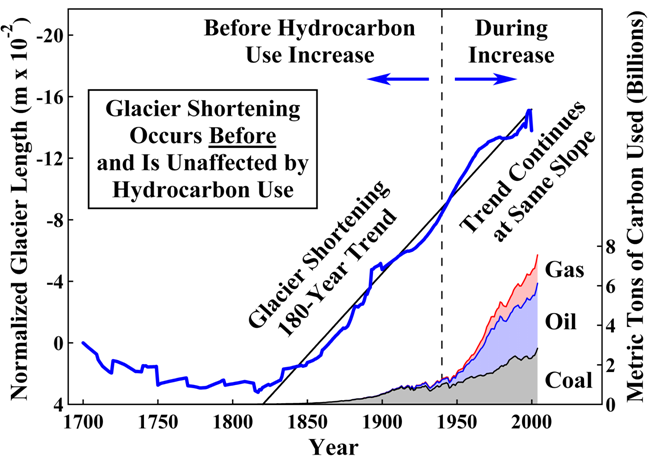
Figure 2: Average length of 169 glaciers from 1700 to 2000 (4). The principal source of melt energy is solar radiation. Variations in glacier mass and length are primarily due to temperature and precipitation (5,6). This melting trend lags the temperature increase by about 20 years, so it predates the 6-fold increase in hydrocarbon use (7) even more than shown in the figure. Hydrocarbon use could not have caused this shortening trend.
The most recent part of this warming period is reflected by shortening of world glaciers, as shown in Figure 2. Glaciers regularly lengthen and shorten in delayed correlation with cooling and warming trends. Shortening lags temperature by about 20 years, so the current warming trend began in about 1800.
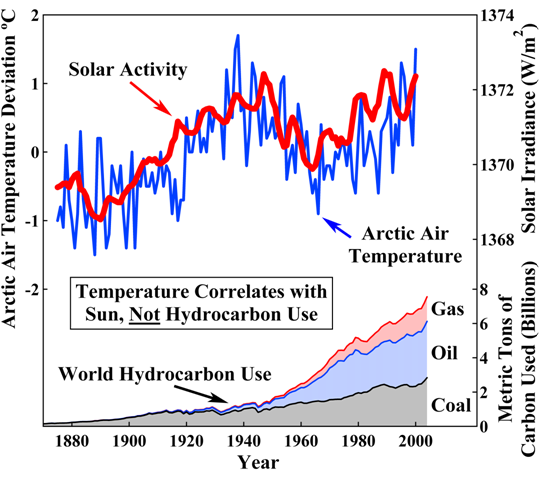
Figure 3: Arctic surface air temperature compared with total solar irradiance as measured by sunspot cycle amplitude, sunspot cycle length, solar equatorial rotation rate, fraction of penumbral spots, and decay rate of the 11-year sunspot cycle (8,9). Solar irradiance correlates well with Arctic temperature, while hydrocarbon use (7) does not correlate.
Atmospheric temperature is regulated by the sun, which fluctuates in activity as shown in Figure 3; by the greenhouse effect, largely caused by atmospheric water vapor (H2O); and by other phenomena that are more poorly understood. While major greenhouse gas H2O substantially warms the Earth, minor greenhouse gases such as CO2 have little effect, as shown in Figures 2 and 3. The 6-fold increase in hydrocarbon use since 1940 has had no noticeable effect on atmospheric temperature or on the trend in glacier length.
While Figure 1 is illustrative of most geographical locations, there is great variability of temperature records with location and regional climate. Comprehensive surveys of published temperature records confirm the principal features of Figure 1, including the fact that the current Earth temperature is approximately 1 °C lower than that during the Medieval Climate Optimum 1,000 years ago (11,12).
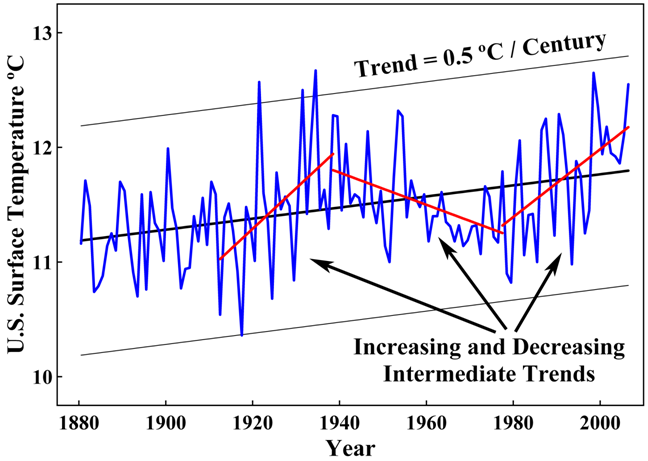
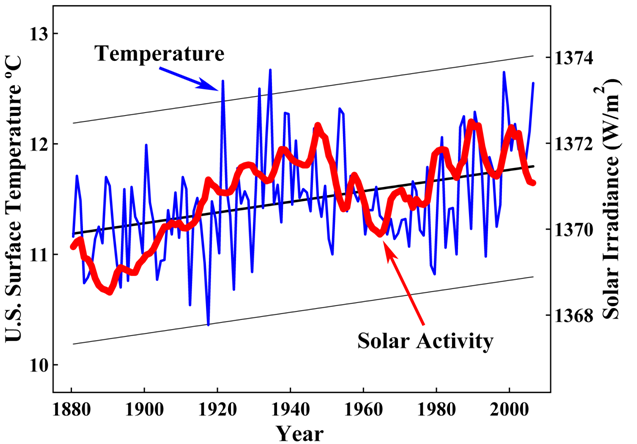
Figure 4: Annual mean surface temperatures in the contiguous United States between 1880 and 2006 (10). The slope of the least-squares trend line for this 127-year record is 0.5 ºC per century.
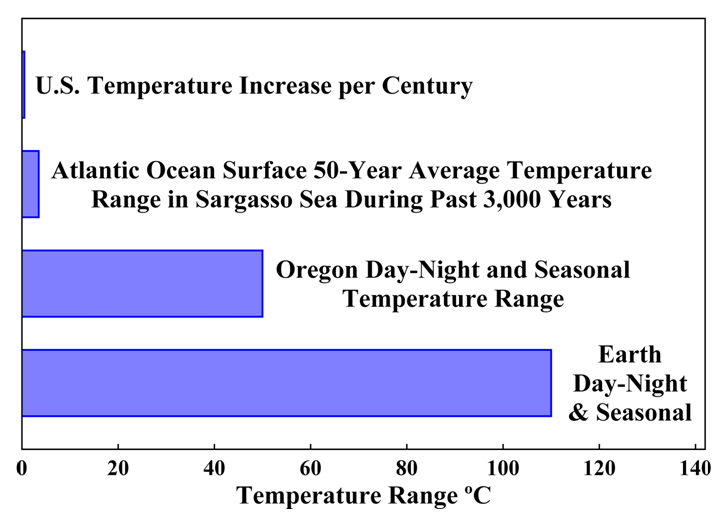
Surface temperatures in the United States during the past century reflect this natural warming trend and its correlation with solar activity, as shown in Figures 4 and 5. Compiled U.S. surface temperatures have increased about 0.5 °C per century, which is consistent with other historical values of 0.4 to 0.5 °C per century during the recovery from the Little Ice Age (13-17). This temperature change is slight as compared with other natural variations, as shown in Figure 6. Three intermediate trends are evident, including the decreasing trend used to justify fears of "global cooling" in the 1970s.
Figure 5: U.S. surface temperature from Figure 4 as compared with total solar irradiance (19) from Figure 3.
Between 1900 and 2000, on absolute scales of solar irradiance and degrees Kelvin, solar activity increased 0.19%, while a 0.5 °C temperature change is 0.21%. This is in good agreement with estimates that Earth's temperature would be reduced by 0.6 °C through particulate blocking of the sun by 0.2% (18).
Figure 6: Comparison between the current U.S. temperature change per century, the 3,000-year temperature range in Figure 1, seasonal and diurnal range in Oregon, and seasonal and diurnal range throughout the Earth.
Solar activity and U.S. surface temperature are closely correlated, as shown in Figure 5, but U.S. surface temperature and world hydrocarbon use are not correlated, as shown in Figure 13.
The U.S. temperature trend is so slight that, were the temperature change which has taken place during the 20th and 21st centuries to occur in an ordinary room, most of the people in the room would be unaware of it.
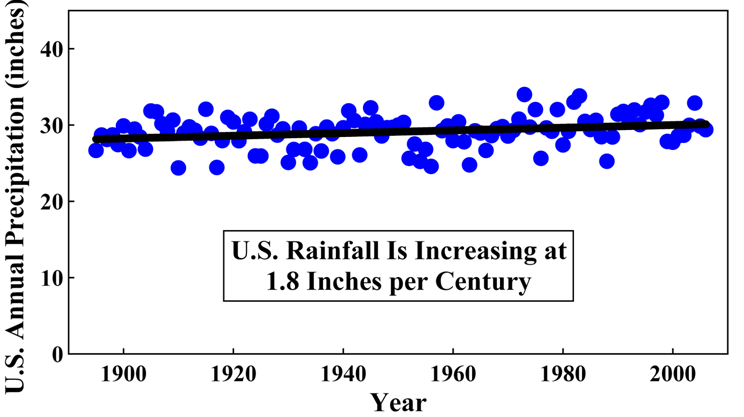
Figure 7: Annual precipitation in the contiguous 48 United States between 1895 and 2006. U.S. National Climatic Data Center, U.S. Department of Commerce 2006 Climate Review (20). The trend shows an increase in rainfall of 1.8 inches per century – approximately 6% per century.
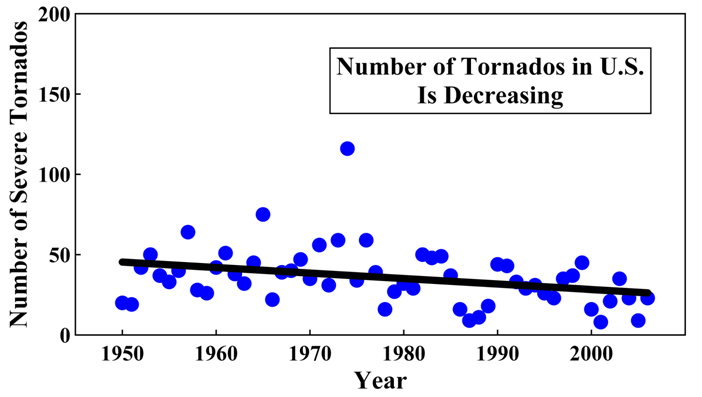
During the current period of recovery from the Little Ice Age, the U.S. climate has improved somewhat, with more rainfall, fewer tornados, and no increase in hurricane activity, as illustrated in Figures 7 to 10. Sea level has trended upward for the past 150 years at a rate of 7 inches per century, with 3 intermediate uptrends and 2 periods of no increase as shown in Figure 11. These features are confirmed by the glacier record as shown in Figure 12. If this trend continues as did that prior to the Medieval Climate Optimum, sea level would be expected to rise about 1 foot during the next 200 years.
As shown in Figures 2, 11, and 12, the trends in glacier shortening and sea level rise began a century before the 60-year 6-fold increase in hydrocarbon use, and have not changed during that increase. Hydrocarbon use could not have caused these trends.
Figure 8: Annual number of strong-to-violent category F3 to F5 tornados during the March-to-August tornado season in the U.S. between 1950 and 2006. U.S. National Climatic Data Center, U.S. Department of Commerce 2006 Climate Review (20). During this period, world hydrocarbon use increased 6-fold, while violent tornado frequency decreased by 43%.
During the past 50 years, atmospheric CO2 has increased by 22%. Much of that CO2 increase is attributable to the 6-fold increase in human use of hydrocarbon energy. Figures 2, 3, 11, 12, and 13 show, however, that human use of hydrocarbons has not caused the observed increases in temperature.
The increase in atmospheric carbon dioxide has, however, had a substantial environmental effect. Atmospheric CO2 fertilizes plants. Higher CO2 enables plants to grow faster and larger and to live in drier climates. Plants provide food for animals, which are thereby also enhanced. The extent and diversity of plant and animal life have both increased substantially during the past half-century. Increased temperature has also mildly stimulated plant growth.
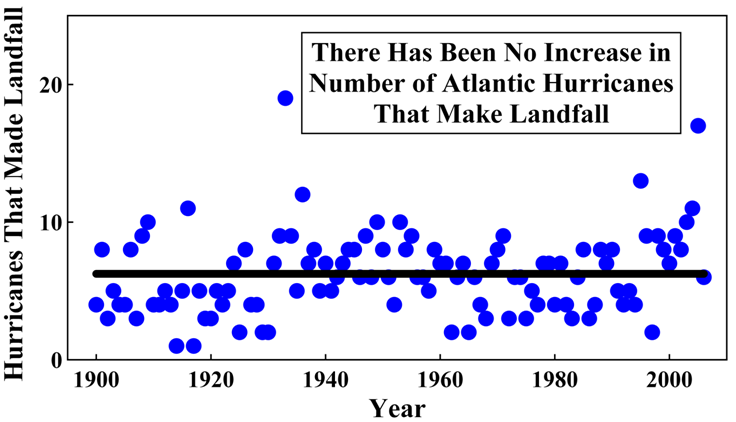
Figure 9: Annual number of Atlantic hurricanes that made landfall between 1900 and 2006 (21). Line is drawn at mean value.
Does a catastrophic amplification of these trends with damaging climatological consequences lie ahead? There are no experimental data that suggest this. There is also no experimentally validated theoretical evidence of such an amplification.
Predictions of catastrophic global warming are based on computer climate modeling, a branch of science still in its infancy. The empirical evidence – actual measurements of Earth's temperature and climate – shows no man-made warming trend. Indeed, during four of the seven decades since 1940 when average CO2 levels steadily increased, U.S. average temperatures were actually decreasing. While CO2 levels have increased substantially and are expected to continue doing so and humans have been responsible for part of this increase, the effect on the environment has been benign.
There is, however, one very dangerous possibility.
Our industrial and technological civilization depends upon abundant, low-cost energy. This civilization has already brought unprecedented prosperity to the people of the more developed nations. Billions of people in the less developed nations are now lifting themselves from poverty by adopting this technology.
Figure 10: Annual number of violent hurricanes and maximum attained wind speed during those hurricanes in the Atlantic Ocean between 1944 and 2006 (22,23). There is no upward trend in either of these records. During this period, world hydrocarbon use increased 6-fold. Lines are mean values.
Hydrocarbons are essential sources of energy to sustain and extend prosperity. This is especially true of the developing nations, where available capital and technology are insufficient to meet rapidly increasing energy needs without extensive use of hydrocarbon fuels. If, through misunderstanding of the underlying science and through misguided public fear and hysteria, mankind significantly rations and restricts the use of hydrocarbons, the worldwide increase in prosperity will stop. The result would be vast human suffering and the loss of hundreds of millions of human lives. Moreover, the prosperity of those in the developed countries would be greatly reduced.
Figure 11: Global sea level measured by surface gauges between 1807 and 2002 (24) and by satellite between 1993 and 2006 (25). Satellite measurements are shown in gray and agree with tide gauge measurements. The overall trend is an increase of 7 inches per century. Intermediate trends are 9, 0, 12, 0, and 12 inches per century, respectively. This trend lags the temperature increase, so it predates the increase in hydrocarbon use even more than is shown. It is unaffected by the very large increase in hydrocarbon use.
Mild ordinary natural increases in the Earth's temperature have occurred during the past two to three centuries. These have resulted in some improvements in overall climate and also some changes in the landscape, such as a reduction in glacier lengths and increased vegetation in colder areas. Far greater changes have occurred during the time that all current species of animals and plants have been on the Earth. The relative population sizes of the species and their geographical distributions vary as they adapt to changing conditions.
Figure 12: Glacier shortening (4) and sea level rise (24,25). Gray area designates estimated range of error in the sea level record. These measurements lag air temperature increases by about 20 years. So, the trends began more than a century before increases in hydrocarbon use.
The temperature of the Earth is continuing its process of fluctuation in correlation with variations in natural phenomena. Mankind, meanwhile, is moving some of the carbon in coal, oil, and natural gas from below ground to the atmosphere and surface, where it is available for conversion into living things. We are living in an increasingly lush environment of plants and animals as a result. This is an unexpected and wonderful gift from the Industrial Revolution.
Atmospheric and surface temperatures have been recovering from an unusually cold period. During the time between 200 and 500 years ago, the Earth was experiencing the "Little Ice Age." It had descended into this relatively cool period from a warm interval about 1,000 years ago known as the "Medieval Climate Optimum." This is shown in Figure 1 for the Sargasso Sea.
During the Medieval Climate Optimum, temperatures were warm enough to allow the colonization of Greenland. These colonies were abandoned after the onset of colder temperatures. For the past 200 to 300 years, Earth temperatures have been gradually recovering (26). Sargasso Sea temperatures are now approximately equal to the average for the previous 3,000 years.
The historical record does not contain any report of "global warming" catastrophes, even though temperatures have been higher than they are now during much of the last three millennia.
The 3,000-year range of temperatures in the Sargasso Sea is typical of most places. Temperature records vary widely with geographical location as a result of climatological characteristics unique to those specific regions, so an "average" Earth temperature is less meaningful than individual records (27). So called "global" or "hemispheric" averages contain errors created by averaging systematically different aspects of unique geographical regions and by inclusion of regions where temperature records are unreliable.
Three key features of the temperature record – the Medieval Climate Optimum, the Little Ice Age, and the Not-Unusual-Temperature of the 20th century – have been verified by a review of local temperature and temperature-correlated records throughout the world (11), as summarized in Table 1. Each record was scored with respect to those queries to which it applied. The experimental and historical literature definitively confirms the primary features of Figure 1.
Table 1: Comprehensive review of all instances in which temperature or temperature-correlated records from localities throughout the world permit answers to queries concerning the existence of the Medieval Climate Optimum, the Little Ice Age, and an unusually warm anomaly in the 20th century (11). The compiled and tabulated answers confirm the three principal features of the Sargasso Sea record shown in Figure 1. The probability that the answer to the query in column 1 is "yes" is given in column 5.
Most geographical locations experienced both the Medieval Climate Optimum and the Little Ice Age – and most locations did not experience temperatures that were unusually warm during the 20th century. A review of 23 quantitative records has demonstrated that mean and median world temperatures in 2006 were, on average, approximately 1 °C or 2 °F cooler than in the Medieval Period (12).
Figure 13: Seven independent records – solar activity (9); Northern Hemisphere, (13), Arctic (28), global (10), and U.S. (10) annual surface air temperatures; sea level (24,25); and glacier length (4) – all qualitatively confirm each other by exhibiting three intermediate trends – warmer, cooler, and warmer. Sea level and glacier length are shown minus 20 years, correcting for their 20-year lag of atmospheric temperature. Solar activity, Northern Hemisphere temperature, and glacier lengths show a low in about 1800.Hydrocarbon use (7) is uncorrelated with temperature. Temperature rose for a century before significant hydrocarbon use. Temperature rose between 1910 and 1940, while hydrocarbon use was almost unchanged. Temperature then fell between 1940 and 1972, while hydrocarbon use rose by 330%. Also, the 150 to 200-year slopes of the sea level and glacier trends were unchanged by the very large increase in hydrocarbon use after 1940.
World glacier length (4) and world sea level (24,25) measurements provide records of the recent cycle of recovery. Warmer temperatures diminish glaciers and cause sea level to rise because of decreased ocean water density and other factors.
These measurements show that the trend of 7 inches per century increase in sea level and the shortening trend in average glacier length both began a century before 1940, yet 84% of total human annual hydrocarbon use occurred only after 1940. Moreover, neither of these trends has accelerated during the period between 1940 and 2007, while hydrocarbon use increased 6-fold. Sea level and glacier records are offset by about 20 years because of the delay between temperature rise and glacier and sea level change.
If the natural trend in sea level increase continues for another two centuries as did the temperature rise in the Sargasso Sea as the Earth entered the Medieval Warm Period, sea level would be expected to rise about 1 foot between the years 2000 and 2200. Both the sea level and glacier trends – and the temperature trend that they reflect – are unrelated to hydrocarbon use. A further doubling of world hydrocarbon use would not change these trends.
Figure 12 shows the close correlation between the sea level and glacier records, which further validates both records and the duration and character of the temperature change that gave rise to them.
Figure 4 shows the annual temperature in the United States during the past 127 years. This record has an upward trend of 0.5 ºC per century. Global and Northern Hemisphere surface temperature records shown in Figure 13 trend upward at 0.6 ºC per century. These records are, however, biased toward higher temperatures in several ways. For example, they preferentially use data near populated areas (33), where heat island effects are prevalent, as illustrated in Figure 15. A trend of 0.5 ºC per century is more representative (13-17).
Figure 14: Satellite microwave sounding unit (blue) measurements of tropospheric temperatures in the Northern Hemisphere between 0 and 82.5 N, Southern Hemisphere between 0 and 82.5 S, tropics between 20S and 20N, and the globe between 82.5N and 82.5S between 1979 and 2007 (29), and radiosonde balloon (red) measurements in the tropics (29). The balloon measurements confirm the satellite technique (29-31). The warming anomaly in 1997-1998 (gray) was caused by El Niño, which, like the overall trends, is unrelated to CO2 (32).
The U.S. temperature record has two intermediate uptrends of comparable magnitude, one occurring before the 6-fold increase in hydrocarbon use and one during it. Between these two is an intermediate temperature downtrend, which led in the 1970s to fears of an impending new ice age. This decrease in temperature occurred during a period in which hydrocarbon use increased 3-fold.
Seven independent records – solar irradiance; Arctic, Northern Hemisphere, global, and U.S. annual average surface air temperatures; sea level; and glacier length – all exhibit these three intermediate trends, as shown in Figure 13. These trends confirm one another. Solar irradiance correlates with them. Hydrocarbon use does not.
The intermediate uptrend in temperature between 1980 and 2006 shown in Figure 13 is similar to that shown in Figure 14 for balloon and satellite tropospheric measurements. This trend is more pronounced in the Northern Hemisphere than in the Southern. Contrary to the CO2 warming climate models, however, tropospheric temperatures are not rising faster than surface temperatures.
Figure 6 illustrates the magnitudes of these temperature changes by comparing the 0.5 ºC per century temperature change as the Earth recovers from the Little Ice Age, the range of 50-year averaged Atlantic ocean surface temperatures in the Sargasso Sea over the past 3,000 years, the range of day-night and seasonal variation on average in Oregon, and the range of day-night and seasonal variation over the whole Earth. The two-century-long temperature change is small.
Tropospheric temperatures measured by satellite give comprehensive geographic coverage. Even the satellite measurements, however, contain short and medium-term fluctuations greater than the slight warming trends calculated from them. The calculated trends vary significantly as a function of the most recent fluctuations and the lengths of the data sets, which are short.
Figure 3 shows the latter part of the period of warming from the Little Ice Age in greater detail by means of Arctic air temperature as compared with solar irradiance, as does Figure 5 for U.S. surface temperature. There is a close correlation between solar activity and temperature and none between hydrocarbon use and temperature. Several other studies over a wide variety of time intervals have found similar correlations between climate and solar activity (15, 34-39). Figure 3 also illustrates the uncertainties introduced by limited time records. If the Arctic air temperature data before 1920 were not available, essentially no uptrend would be observed.
This observed variation in solar activity is typical of stars close in size and age to the sun (40). The current warming trends on Mars (41), Jupiter (42), Neptune (43,44), Neptune's moon Triton (45), and Pluto (46-48) may result, in part, from similar relations to the sun and its activity – like those that are warming the Earth.
Hydrocarbon use and atmospheric CO2 do not correlate with the observed temperatures. Solar activity correlates quite well. Correlation does not prove causality, but non-correlation proves non-causality. Human hydrocarbon use is not measurably warming the earth. Moreover, there is a robust theoretical and empirical model for solar warming and cooling of the Earth (8,19,49,50). The experimental data do not prove that solar activity is the only phenomenon responsible for substantial Earth temperature fluctuations, but they do show that human hydrocarbon use is not among those phenomena.
Figure 15: Surface temperature trends for 1940 to 1996 from 107 measuring stations in 49 California counties (51,52). The trends were combined for counties of similar population and plotted with the standard errors of their means. The six measuring stations in Los Angeles County were used to calculate the standard error of that county, which is plotted at a population of 8.9 million. The "urban heat island effect" on surface measurements is evident. The straight line is a least-squares fit to the closed circles. The points marked "X" are the six unadjusted station records selected by NASA GISS (53-55) for use in their estimate of global surface temperatures. Such selections make NASA GISS temperatures too high.
The overall experimental record is self-consistent. The Earth has been warming as it recovers from the Little Ice Age at an average rate of about 0.5 ºC per century. Fluctuations within this temperature trend include periods of more rapid increase and also periods of temperature decrease. These fluctuations correlate well with concomitant fluctuations in the activity of the sun. Neither the trends nor the fluctuations within the trends correlate with hydrocarbon use. Sea level and glacier length reveal three intermediate uptrends and two downtrends since 1800, as does solar activity. These trends are climatically benign and result from natural processes.
The concentration of CO2 in Earth's atmosphere has increased during the past century, as shown in Figure 17. The magnitude of this atmospheric increase is currently about 4 gigatons (Gt C) of carbon per year. Total human industrial CO2 production, primarily from use of coal, oil, and natural gas and the production of cement, is currently about 8 Gt C per year (7,56,57). Humans also exhale about 0.6 Gt C per year, which has been sequestered by plants from atmospheric CO2. Office air concentrations often exceed 1,000 ppm CO2.
To put these figures in perspective, it is estimated that the atmosphere contains 780 Gt C; the surface ocean contains 1,000 Gt C; vegetation, soils, and detritus contain 2,000 Gt C; and the intermediate and deep oceans contain 38,000 Gt C, as CO2 or CO2 hydration products. Each year, the surface ocean and atmosphere exchange an estimated 90 Gt C; vegetation and the atmosphere, 100 Gt C; marine biota and the surface ocean, 50 Gt C; and the surface ocean and the intermediate and deep oceans, 40 Gt C (56,57).
So great are the magnitudes of these reservoirs, the rates of exchange between them, and the uncertainties of these estimated numbers that the sources of the recent rise in atmospheric CO2 have not been determined with certainty (58,59). Atmospheric concentrations of CO2 are reported to have varied widely over geological time, with peaks, according to some estimates, some 20-fold higher than at present and lows at approximately 200 ppm (60-62).
Ice-core records are reported to show seven extended periods during 650,000 years in which CO2, methane (CH4), and temperature increased and then decreased (63-65). Ice-core records contain substantial uncertainties (58), so these correlations are imprecise.
In all seven glacial and interglacial cycles, the reported changes in CO2 and CH4 lagged the temperature changes and could not, therefore, have caused them (66). These fluctuations probably involved temperature-caused changes in oceanic and terrestrial CO2 and CH4 content. More recent CO2 fluctuations also lag temperature (67,68).
Figure 16: Temperature rise versus CO2 rise from seven ice-core measured interglacial periods (63-65); from calculations (69) and measurements (70) of sea water out-gassing; and as measured during the 20th and 21st centuries (10,72). The interglacial temperature increases caused the CO2 rises through release of ocean CO2. The CO2 rises did not cause the temperature rises.In addition to the agreement between the out-gassing estimates and measurements, this conclusion is also verified by the small temperature rise during the 20th and 21st centuries. If the CO2 versus temperature correlation during the seven interglacials had been caused by CO2 greenhouse warming, then the temperature rise per CO2 rise would have been as high during the 20th and 21st centuries as it was during the seven interglacial periods.
In 1957, Revelle and Seuss (69) estimated that temperature-caused out-gassing of ocean CO2 would increase atmospheric CO2 by about 7% per °C temperature rise. The reported change during the seven interglacials of the 650,000-year ice core record is about 5% per °C (63), which agrees with the out-gassing calculation.
Between 1900 and 2006, Antarctic CO2 increased 30% per 0.1 °C temperature change (72), and world CO2 increased 30% per 0.5 °C. In addition to ocean out-gassing, CO2 from human use of hydrocarbons is a new source. Neither this new source nor the older natural CO2 sources are causing atmospheric temperature to change.
The hypothesis that the CO2 rise during the interglacials caused the temperature to rise requires an increase of about 6 °C per 30% rise in CO2 as seen in the ice core record. If this hypothesis were correct, Earth temperatures would have risen about 6 °C between 1900 and 2006, rather than the rise of between 0.1 °C and 0.5 °C, which actually occurred. This difference is illustrated in Figure 16.
The 650,000-year ice-core record does not, therefore, agree with the hypothesis of "human-caused global warming," and, in fact, provides empirical evidence that invalidates this hypothesis.
Figure 17: Atmospheric CO2 concentrations in parts per million by volume, ppm, measured spectrophotometrically at Mauna Loa, Hawaii, between 1958 and 2007. These measurements agree well with those at other locations (71). Data before 1958 are from ice cores and chemical analyses, which have substantial experimental uncertainties. We have used 295 ppm for the period 1880 to 1890, which is an average of the available estimates. About 0.6 Gt C of CO2 is produced annually by human respiration and often leads to concentrations exceeding 1,000 ppm in public buildings. Atmospheric CO2 has increased 22% since 1958 and about 30% since 1880.
Carbon dioxide has a very short residence time in the atmosphere. Beginning with the 7 to 10-year half-time of CO2 in the atmosphere estimated by Revelle and Seuss (69), there were 36 estimates of the atmospheric CO2 half-time based upon experimental measurements published between 1957 and 1992 (59). These range between 2 and 25 years, with a mean of 7.5, a median of 7.6, and an upper range average of about 10. Of the 36 values, 33 are 10 years or less.
Many of these estimates are from the decrease in atmospheric carbon 14 after cessation of atmospheric nuclear weapons testing, which provides a reliable half-time. There is no experimental evidence to support computer model estimates (73) of a CO2 atmospheric "lifetime" of 300 years or more.
Human production of 8 Gt C per year of CO2 is negligible as compared with the 40,000 Gt C residing in the oceans and biosphere. At ultimate equilibrium, human-produced CO2 will have an insignificant effect on the amounts in the various reservoirs. The rates of approach to equilibrium are, however, slow enough that human use creates a transient atmospheric increase.
In any case, the sources and amounts of CO2 in the atmosphere are of secondary importance to the hypothesis of "human-caused global warming." It is human burning of coal, oil, and natural gas that is at issue. CO2 is merely an intermediate in a hypothetical mechanism by which this "human-caused global warming" is said to take place. The amount of atmospheric CO2 does have profound environmental effects on plant and animal populations (74) and diversity, as is discussed below.
While the average temperature change taking place as the Earth recovers from the Little Ice Age is so slight that it is difficult to discern, its environmental effects are measurable. Glacier shortening and the 7 inches per century rise in sea level are examples. There are additional climate changes that are correlated with this rise in temperature and may be caused by it.
Greenland, for example, is beginning to turn green again, as it was 1,000 years ago during the Medieval Climate Optimum (11). Arctic sea ice is decreasing somewhat (75), but Antarctic ice is not decreasing and may be increasing, due to increased snow (76-79).
In the United States, rainfall is increasing at about 1.8 inches per century, and the number of severe tornados is decreasing, as shown in Figures 7 and 8. If world temperatures continue to rise at the current rate, they will reach those of the Medieval Climate Optimum about 2 centuries from now. Historical reports of that period record the growing of warm weather crops in localities too cold for that purpose today, so it is to be expected that the area of more temperate climate will expand as it did then. This is already being observed, as studies at higher altitudes have reported increases in amount and diversity of plant and animal life by more than 50% (12,80).
Atmospheric temperature is increasing more in the Northern Hemisphere than in the Southern, with intermediate periods of increase and decrease in the overall trends.
There has been no increase in frequency or severity of Atlantic hurricanes during the period of 6-fold increase in hydrocarbon use, as is illustrated in Figures 9 and 10. Numbers of violent hurricanes vary greatly from year to year and are no greater now than they were 50 years ago. Similarly, maximum wind speeds have not increased.
All of the observed climate changes are gradual, moderate, and entirely within the bounds of ordinary natural changes that have occurred during the benign period of the past few thousand years.
There is no indication whatever in the experimental data that an abrupt or remarkable change in any of the ordinary natural climate variables is beginning or will begin to take place.
The greenhouse effect amplifies solar warming of the earth. Greenhouse gases such as H2O, CO2, and CH4 in the Earth's atmosphere, through combined convective readjustments and the radiative blanketing effect, essentially decrease the net escape of terrestrial thermal infrared radiation. Increasing CO2, therefore, effectively increases radiative energy input to the Earth's atmosphere. The path of this radiative input is complex. It is redistributed, both vertically and horizontally, by various physical processes, including advection, convection, and diffusion in the atmosphere and ocean.
Figure 18: Qualitative illustration of greenhouse warming. "Present GHE" is the current greenhouse effect from all atmospheric phenomena. "Radiative effect of CO2" is the added greenhouse radiative effect from doubling CO2 without consideration of other atmospheric components. "Hypothesis 1 IPCC" is the hypothetical amplification effect assumed by IPCC. "Hypothesis 2" is the hypothetical moderation effect.
When an increase in CO2 increases the radiative input to the atmosphere, how and in which direction does the atmosphere respond? Hypotheses about this response differ and are schematically shown in Figure 18. Without the water-vapor greenhouse effect, the Earth would be about 14 ºC cooler (81). The radiative contribution of doubling atmospheric CO2 is minor, but this radiative greenhouse effect is treated quite differently by different climate hypotheses. The hypotheses that the IPCC (82,83) has chosen to adopt predict that the effect of CO2 is amplified by the atmosphere, especially by water vapor, to produce a large temperature increase. Other hypotheses, shown as hypothesis 2, predict the opposite – that the atmospheric response will counteract the CO2 increase and result in insignificant changes in global temperature (81,84,85,91,92). The experimental evidence, as described above, favors hypothesis 2. While CO2 has increased substantially, its effect on temperature has been so slight that it has not been experimentally detected.
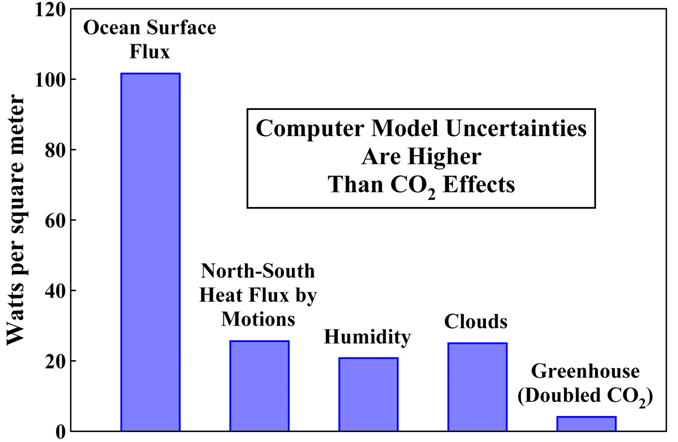
Figure 19: The radiative greenhouse effect of doubling the concentration of atmospheric CO2 (right bar) as compared with four of the uncertainties in the computer climate models (87,93).
The computer climate models upon which "human-caused global warming" is based have substantial uncertainties and are markedly unreliable. This is not surprising, since the climate is a coupled, non-linear dynamical system. It is very complex. Figure 19 illustrates the difficulties by comparing the radiative CO2 greenhouse effect with correction factors and uncertainties in some of the parameters in the computer climate calculations. Other factors, too, such as the chemical and climatic influence of volcanoes, cannot now be reliably computer modeled.
In effect, an experiment has been performed on the Earth during the past half-century – an experiment that includes all of the complex factors and feedback effects that determine the Earth's temperature and climate. Since 1940, hydrocarbon use has risen 6-fold. Yet, this rise has had no effect on the temperature trends, which have continued their cycle of recovery from the Little Ice Age in close correlation with increasing solar activity.
Not only has the global warming hypothesis failed experimental tests, it is theoretically flawed as well. It can reasonably be argued that cooling from negative physical and biological feedbacks to greenhouse gases nullifies the slight initial temperature rise (84,86).
The reasons for this failure of the computer climate models are subjects of scientific debate (87). For example, water vapor is the largest contributor to the overall greenhouse effect (88). It has been suggested that the climate models treat feedbacks from clouds, water vapor, and related hydrology incorrectly (85,89-92).
The global warming hypothesis with respect to CO2 is not based upon the radiative properties of CO2 itself, which is a very weak greenhouse gas. It is based upon a small initial increase in temperature caused by CO2 and a large theoretical amplification of that temperature increase, primarily through increased evaporation of H2O, a strong greenhouse gas. Any comparable temperature increase from another cause would produce the same calculated outcome.
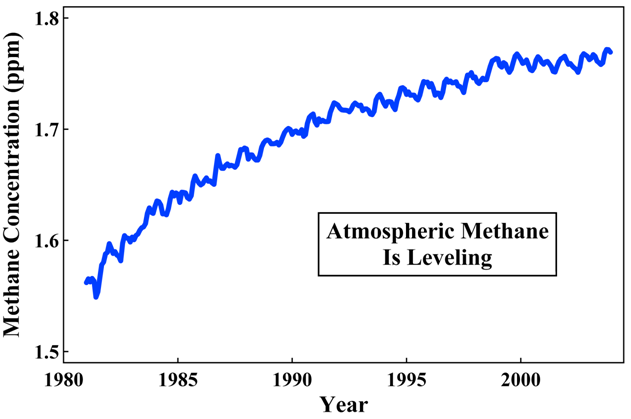
Figure 20: Global atmospheric methane concentration in parts per million between 1982 and 2004 (94).
Thus, the 3,000-year temperature record illustrated in Figure 1 also provides a test of the computer models. The historical temperature record shows that the Earth has previously warmed far more than could be caused by CO2 itself. Since these past warming cycles have not initiated water-vapor-mediated atmospheric warming catastrophes, it is evident that weaker effects from CO2 cannot do so.
Methane is also a minor greenhouse gas. World CH4 levels are, as shown in Figure 20, leveling off. In the U.S. in 2005, 42% of human-produced methane was from hydrocarbon energy production, 28% from waste management, and 30% from agriculture (95). The total amount of CH4 produced from these U.S. sources decreased 7% between 1980 and 2005. Moreover, the record shows that, even while methane was increasing, temperature trends were benign.
The "human-caused global warming" – often called the "global warming" – hypothesis depends entirely upon computer model-generated scenarios of the future. There are no empirical records that verify either these models or their flawed predictions (96).
Claims (97) of an epidemic of insect-borne diseases, extensive species extinction, catastrophic flooding of Pacific islands, ocean acidification, increased numbers and severities of hurricanes and tornados, and increased human heat deaths from the 0.5 °C per century temperature rise are not consistent with actual observations. The "human-caused global warming" hypothesis and the computer calculations that support it are in error. They have no empirical support and are invalidated by numerous observations.
World temperature is controlled by natural phenomena. What steps could mankind take if solar activity or other effects began to shift the Earth toward temperatures too cold or too warm for optimum human life?
First, it would be necessary to determine what temperature humans feel is optimum. It is unlikely that the chosen temperature would be exactly that which we have today. Second, we would be fortunate if natural forces were to make the Earth too warm rather than too cold because we can cool the Earth with relative ease. We have no means by which to warm it. Attempting to warm the Earth with addition of CO2 or to cool the Earth by restrictions of CO2 and hydrocarbon use would, however, be futile. Neither would work.
Inexpensively blocking the sun by means of particles in the upper atmosphere would be effective. S.S. Penner, A.M. Schneider, and E. M. Kennedy have proposed (98) that the exhaust systems of commercial airliners could be tuned in such a way as to eject particulate sun-blocking material into the upper atmosphere. Later, Edward Teller similarly suggested (18) that particles could be injected into the atmosphere in order to reduce solar heating and cool the Earth. Teller estimated a cost of between $500 million and $1 billion per year for between 1 ºC and 3 ºC of cooling. Both methods use particles so small that they would be invisible from the Earth.
These methods would be effective and economical in blocking solar radiation and reducing atmospheric and surface temperatures. There are other similar proposals (99). World energy rationing, on the other hand, would not work.
The climate of the Earth is now benign. If temperatures become too warm, this can easily be corrected. If they become too cold, we have no means of response – except to maximize nuclear and hydrocarbon energy production and technological advance. This would help humanity adapt and might lead to new mitigation technology.
How high will the CO2 concentration of the atmosphere ultimately rise if mankind continues to increase the use of coal, oil, and natural gas? At ultimate equilibrium with the ocean and other reservoirs there will probably be very little increase. The current rise is a non-equilibrium result of the rate of approach to equilibrium.
One reservoir that would moderate the increase is especially important. Plant life provides a large sink for CO2. Using current knowledge about the increased growth rates of plants and assuming increased CO2 release as compared to current emissions, it has been estimated that atmospheric CO2 levels may rise to about 600 ppm before leveling off. At that level, CO2 absorption by increased Earth biomass is able to absorb about 10 Gt C per year (100). At present, this absorption is estimated to be about 3 Gt C per year (57).
About 30% of this projected rise from 295 to 600 ppm has already taken place, without causing unfavorable climate changes. Moreover, the radiative effects of CO2 are logarithmic (101,102), so more than 40% of any climatic influences have already occurred.
As atmospheric CO2 increases, plant growth rates increase. Also, leaves transpire less and lose less water as CO2 increases, so that plants are able to grow under drier conditions. Animal life, which depends upon plant life for food, increases proportionally.
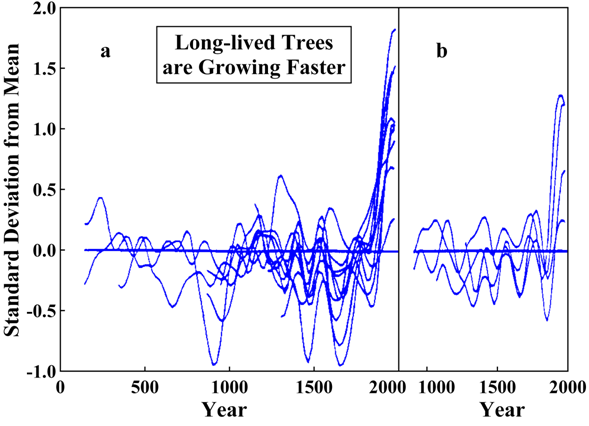
Figure 21: Standard deviation from the mean of tree ring widths for (a) bristlecone pine, limber pine, and fox tail pine in the Great Basin of California, Nevada, and Arizona and (b) bristlecone pine in Colorado (110). Tree ring widths were averaged in 20-year segments and then normalized so that the means of prior tree growth were zero. The deviations from the means are shown in units of standard deviations of those means.
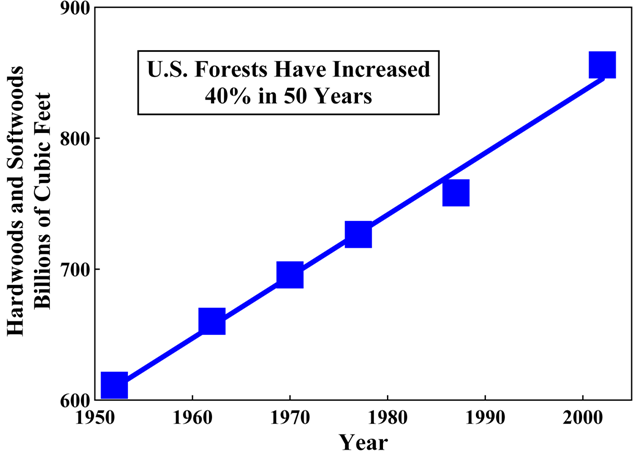
Figures 21 to 24 show examples of experimentally measured increases in the growth of plants. These examples are representative of a very large research literature on this subject (103-109). As Figure 21 shows, long-lived 1,000- to 2,000-year-old pine trees have shown a sharp increase in growth during the past half-century. Figure 22 shows the 40% increase in the forests of the United States that has taken place since 1950. Much of this increase is due to the increase in atmospheric CO2 that has already occurred. In addition, it has been reported that Amazonian rain forests are increasing their vegetation by about 900 pounds of carbon per acre per year (113), or approximately 2 tons of biomass per acre per year. Trees respond to CO2 fertilization more strongly than do most other plants, but all plants respond to some extent.
Figure 22: Inventories of standing hardwood and softwood timber in the United States compiled in Forest Resources of the United States, 2002, U.S. Department of Agriculture Forest Service (111,112). The linear trend cited in 1998 (1) with an increase of 30% has continued. The increase is now 40%. The amount of U.S. timber is rising almost 1% per year.
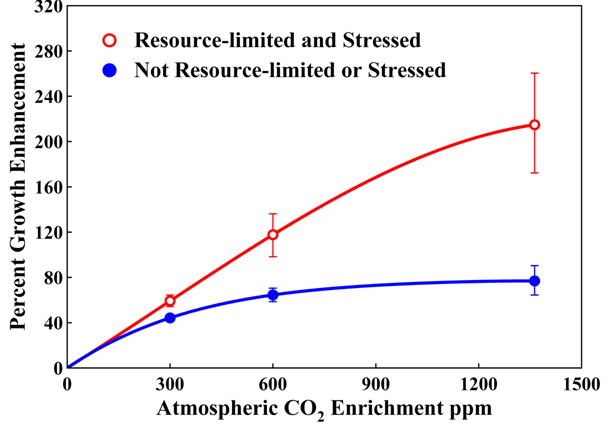
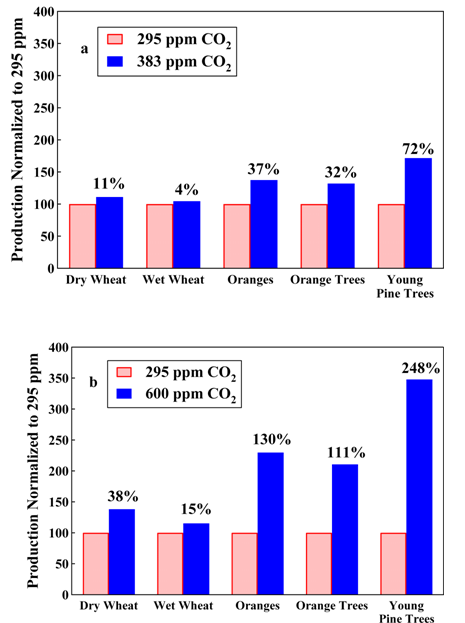
Since plant response to CO2 fertilization is nearly linear with respect to CO2 concentration over the range from 300 to 600 ppm, as seen in Figure 23, experimental measurements at different levels of CO2 enrichment can be extrapolated. This has been done in Figure 24 in order to illustrate CO2 growth enhancements calculated for the atmospheric increase of about 88 ppm that has already taken place and those expected from a projected total increase of 305 ppm.
Wheat growth is accelerated by increased atmospheric CO2, especially under dry conditions. Figure 24 shows the response of wheat grown under wet conditions versus that of wheat stressed by lack of water. The underlying data is from open-field experiments. Wheat was grown in the usual way, but the atmospheric CO2 concentrations of circular sections of the fields were increased by arrays of computer-controlled equipment that released CO2 into the air to hold the levels as specified (115,116). Orange and young pine tree growth enhancement (117-119) with two atmospheric CO2 increases – that which has already occurred since 1885 and that projected for the next two centuries – is also shown. The relative growth enhancement of trees by CO2 diminishes with age. Figure 24 shows young trees.
Figure 23: Summary data from 279 published experiments in which plants of all types were grown under paired stressed (open red circles) and unstressed (closed blue circles) conditions (114). There were 208, 50, and 21 sets at 300, 600, and an average of about 1350 ppm CO2, respectively. The plant mixture in the 279 studies was slightly biased toward plant types that respond less to CO2 fertilization than does the actual global mixture. Therefore, the figure underestimates the expected global response. CO2 enrichment also allows plants to grow in drier regions, further increasing the response.
Figure 23 summarizes 279 experiments in which plants of various types were raised under CO2-enhanced conditions. Plants under stress from less-than-ideal conditions – a common occurrence in nature – respond more to CO2 fertilization. The selections of species in Figure 23 were biased toward plants that respond less to CO2 fertilization than does the mixture actually covering the Earth, so Figure 23 underestimates the effects of global CO2 enhancement.
Figure 24: Calculated (1,2) growth rate enhancement of wheat, young orange trees, and very young pine trees already taking place as a result of atmospheric enrichment by CO2 from 1885 to 2007 (a), and expected as a result of atmospheric enrichment by CO2 to a level of 600 ppm (b).
Clearly, the green revolution in agriculture has already benefitted from CO2 fertilization, and benefits in the future will be even greater. Animal life is increasing proportionally, as shown by studies of 51 terrestrial (120) and 22 aquatic ecosystems (121). Moreover, as shown by a study of 94 terrestrial ecosystems on all continents except Antarctica (122), species richness – biodiversity – is more positively correlated with productivity – the total quantity of plant life per acre – than with anything else.
Atmospheric CO2 is required for life by both plants and animals. It is the sole source of carbon in all of the protein, carbohydrate, fat, and other organic molecules of which living things are constructed.
Plants extract carbon from atmospheric CO2 and are thereby fertilized. Animals obtain their carbon from plants. Without atmospheric CO2, none of the life we see on Earth would exist.
Water, oxygen, and carbon dioxide are the three most important substances that make life possible.
They are surely not environmental pollutants.
The single most important human component in the preservation of the Earth's environment is energy. Industrial conversion of energy into forms that are useful for human activities is the most important aspect of technology. Abundant inexpensive energy is required for the prosperous maintenance of human life and the continued advance of life-enriching technology. People who are prosperous have the wealth required to protect and enhance their natural environment.
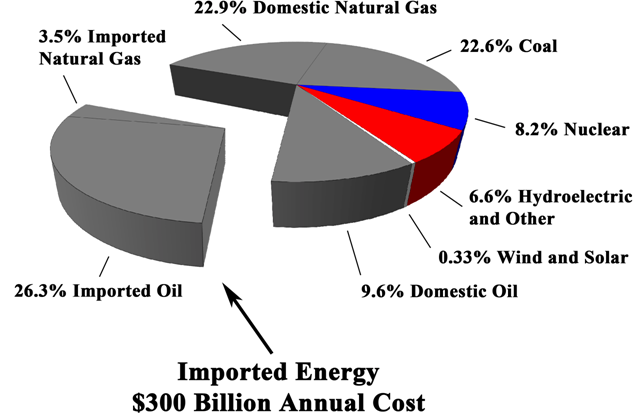
Currently, the United States is a net importer of energy as shown in Figure 25. Americans spend about $300 billion per year for imported oil and gas – and an additional amount for military expenses related to those imports.
Figure 25: In 2006, the United States obtained 84.9% of its energy from hydrocarbons, 8.2% from nuclear fuels, 2.9% from hydroelectric dams, 2.1% from wood, 0.8% from biofuels, 0.4% from waste, 0.3% from geothermal, and 0.3% from wind and solar radiation. The U.S. uses 21 million barrels of oil per day – 27% from OPEC, 17% from Canada and Mexico, 16% from others, and 40% produced in the U.S. (95). The cost of imported oil and gas at $60 per barrel and $7 per 1,000 ft3 in 2007 is about $300 billion per year.
Political calls for a reduction of U.S. hydrocarbon use by 90% (123), thereby eliminating 75% of America's energy supply, are obviously impractical. Nor can this 75% of U.S. energy be replaced by alternative "green" sources. Despite enormous tax subsidies over the past 30 years, green sources still provide only 0.3% of U.S. energy.
Yet, the U.S. clearly cannot continue to be a large net importer of energy without losing its economic and industrial strength and its political independence. It should, instead, be a net exporter of energy.
There are three realistic technological paths to American energy independence – increased use of hydrocarbon energy, nuclear energy, or both. There are no climatological impediments to increased use of hydrocarbons, although local environmental effects can and must be accommodated. Nuclear energy is, in fact, less expensive and more environmentally benign than hydrocarbon energy, but it too has been the victim of the politics of fear and claimed disadvantages and dangers that are actually negligible.
For example, the "problem" of high-level "nuclear waste" has been given much attention, but this problem has been politically created by U.S. government barriers to American fuel breeding and reprocessing. Spent nuclear fuel can be recycled into new nuclear fuel. It need not be stored in expensive repositories.
Reactor accidents are also much publicized, but there has never been even one human death associated with an American nuclear reactor incident. By contrast, American dependence on automobiles results in more than 40,000 human deaths per year.
All forms of energy generation, including "green" methods, entail industrial deaths in the mining, manufacture, and transport of resources they require. Nuclear energy requires the smallest amount of such resources (124) and therefore has the lowest risk of deaths.
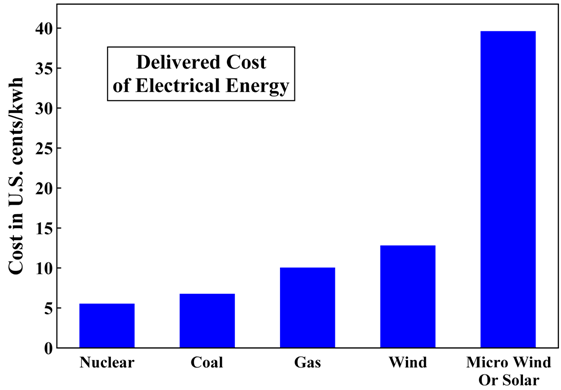
Estimated relative costs of electrical energy production vary with geographical location and underlying assumptions. Figure 26 shows a recent British study, which is typical. At present, 43% of U.S. energy consumption is used for electricity production.
To be sure, future inventions in energy technology may alter the relative economics of nuclear, hydrocarbon, solar, wind, and other methods of energy generation. These inventions cannot, however, be forced by political fiat, nor can they be wished into existence. Alternatively, "conservation," if practiced so extensively as to be an alternative to hydrocarbon and nuclear power, is merely a politically correct word for "poverty."
The current untenable situation in which the United States is losing $300 billion per year to pay for foreign oil and gas is not the result of failures of government energy production efforts. The U.S. government does not produce energy. Energy is produced by private industry. Why then has energy production thrived abroad while domestic production has stagnated?
This stagnation has been caused by United States government taxation, regulation, and sponsorship of litigation, which has made the U.S. a very unfavorable place to produce energy. In addition, the U.S. government has spent vast sums of tax money subsidizing inferior energy technologies for political purposes.
It is not necessary to discern in advance the best course to follow. Legislative repeal of taxation, regulation, incentives to litigation, and repeal of all subsidies of energy generation industries would stimulate industrial development, wherein competition could then automatically determine the best paths.
Nuclear power is safer, less expensive, and more environmentally benign than hydrocarbon power, so it is probably the better choice for increased energy production. Solid, liquid and gaseous hydrocarbon fuels provide, however, many conveniences, and a national infrastructure to use them is already in place. Oil from shale or coal liquefaction is less expensive than crude oil at current prices, but its ongoing production costs are higher than those for already developed oil fields. There is, therefore, an investment risk that crude oil prices could drop so low that liquefaction plants could not compete. Nuclear energy does not have this disadvantage, since the operating costs of nuclear power plants are very low.
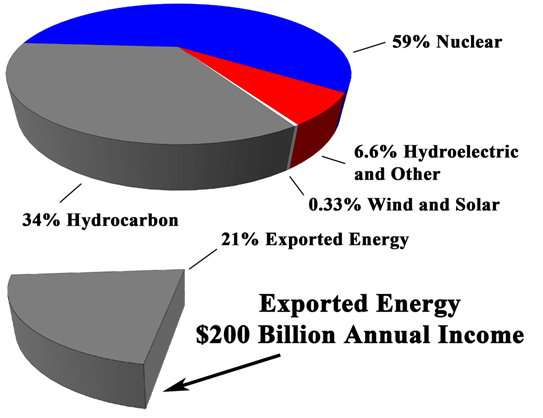
Figure 27 illustrates, as an example, one practical and environmentally sound path to U.S. energy independence. At present 19% of U.S. electricity is produced by 104 nuclear power reactors with an average generating output in 2006 of 870 megawatts per reactor, for a total of about 90 GWe (gigawatts) (125). If this were increased by 560 GWe, nuclear power could fill all current U.S. electricity requirements and have 230 GWe left over for export as electricity or as hydrocarbon fuels replaced or manufactured.
Figure 26: Delivered cost per kilowatt hour of electrical energy in Great Britain in 2006, without CO2 controls (126). These estimates include all capital and operational expenses for a period of 50 years. Micro wind or solar are units installed for individual homes.
Thus, rather than a $300 billion trade loss, the U.S. would have a $200 billion trade surplus – and installed capacity for future U.S. requirements. Moreover, if heat from additional nuclear reactors were used for coal liquefaction and gasification, the U.S. would not even need to use its oil resources. The U.S. has about 25% of the world's coal reserves. This heat could also liquify biomass, trash, or other sources of hydrocarbons that might eventually prove practical.
Figure 27: Construction of one Palo Verde installation with 10 reactors in each of the 50 states. Energy trade deficit is reversed by $500 billion per year, resulting in a $200 billion annual surplus. Currently, this solution is not possible owing to misguided government policies, regulations, and taxation and to legal maneuvers available to anti-nuclear activists. These impediments should be legislatively repealed.
The Palo Verde nuclear power station near Phoenix, Arizona, was originally intended to have 10 nuclear reactors with a generating capacity of 1,243 megawatts each. As a result of public hysteria caused by false information – very similar to the human-caused global warming hysteria being spread today, construction at Palo Verde was stopped with only three operating reactors completed. This installation is sited on 4,000 acres of land and is cooled by waste water from the city of Phoenix, which is a few miles away. An area of 4,000 acres is 6.25 square miles or 2.5 miles square. The power station itself occupies only a small part of this total area.
If just one station like Palo Verde were built in each of the 50 states and each installation included 10 reactors as originally planned for Palo Verde, these plants, operating at the current 90% of design capacity, would produce 560 GWe of electricity. Nuclear technology has advanced substantially since Palo Verde was built, so plants constructed today would be even more reliable and efficient.
Assuming a construction cost of $2.3 billion per 1,200 MWe reactor (127) and 15% economies of scale, the total cost of this entire project would be $1 trillion, or 4 months of the current U.S. federal budget. This is 8% of the annual U.S. gross domestic product. Construction costs could be repaid in just a few years by the capital now spent by the people of the United States for foreign oil and by the change from U.S. import to export of energy.
The 50 nuclear installations might be sited on a population basis. If so, California would have six, while Oregon and Idaho together would have one. In view of the great economic value of these facilities, there would be vigorous competition for them.
In addition to these power plants, the U.S. should build fuel reprocessing capability, so that spent nuclear fuel can be reused. This would lower fuel cost and eliminate the storage of high-level nuclear waste. Fuel for the reactors can be assured for 1,000 years (128) by using both ordinary reactors with high breeding ratios and specific breeder reactors, so that more fuel is produced than consumed.
About 33% of the thermal energy in an ordinary nuclear reactor is converted to electricity. Some new designs are as high as 48%. The heat from a 1,243 MWe reactor can produce 38,000 barrels of coal-derived oil per day (129). With one additional Palo Verde installation in each state for oil production, the yearly output would be at least 7 billion barrels per year with a value, at $60 per barrel, of more than $400 billion per year. This is twice the oil production of Saudi Arabia. Current proven coal reserves of the United States are sufficient to sustain this production for 200 years (128). This liquified coal exceeds the proven oil reserves of the entire world. The reactors could produce gaseous hydrocarbons from coal, too.
The remaining heat from nuclear power plants could warm air or water for use in indoor climate control and other purposes.
Nuclear reactors can also be used to produce hydrogen, instead of oil and gas (130,131). The current cost of production and infrastructure is, however, much higher for hydrogen than for oil and gas. Technological advance reduces cost, but usually not abruptly. A prescient call in 1800 for the world to change from wood to methane would have been impracticably ahead of its time, as may be a call today for an abrupt change from oil and gas to hydrogen. In distinguishing the practical from the futuristic, a free market in energy is absolutely essential.
Surely these are better outcomes than are available through international rationing and taxation of energy as has been recently proposed (82,83,97,123). This nuclear energy example demonstrates that current technology can produce abundant inexpensive energy if it is not politically suppressed.
There need be no vast government program to achieve this goal. It could be reached simply by legislatively removing all taxation, most regulation and litigation, and all subsidies from all forms of energy production in the U.S., thereby allowing the free market to build the most practical mixture of methods of energy generation.
With abundant and inexpensive energy, American industry could be revitalized, and the capital and energy required for further industrial and technological advance could be assured. Also assured would be the continued and increased prosperity of all Americans.
The people of the United States need more low-cost energy, not less. If this energy is produced in the United States, it can not only become a very valuable export, but it can also ensure that American industry remains competitive in world markets and that hoped-for American prosperity continues and grows.
In this hope, Americans are not alone. Across the globe, billions of people in poorer nations are struggling to improve their lives. These people need abundant low-cost energy, which is the currency of technological progress.
In newly developing countries, that energy must come largely from the less technologically complicated hydrocarbon sources. It is a moral imperative that this energy be available. Otherwise, the efforts of these peoples will be in vain, and they will slip backwards into lives of poverty, suffering, and early death.
Energy is the foundation of wealth. Inexpensive energy allows people to do wonderful things. For example, there is concern that it may become difficult to grow sufficient food on the available land. Crops grow more abundantly in a warmer, higher CO2 environment, so this can mitigate future problems that may arise (12).
Energy provides, however, an even better food insurance plan. Energy-intensive hydroponic greenhouses are 2,000 times more productive per unit land area than are modern American farming methods (132). Therefore, if energy is abundant and inexpensive, there is no practical limit to world food production.
Fresh water is also believed to be in short supply. With plentiful inexpensive energy, sea water desalination can provide essentially unlimited supplies of fresh water.
During the past 200 years, human ingenuity in the use of energy has produced many technological miracles. These advances have markedly increased the quality, quantity, and length of human life. Technologists of the 21st century need abundant, inexpensive energy with which to continue this advance.
Were this bright future to be prevented by world energy rationing, the result would be tragic indeed. In addition to human loss, the Earth's environment would be a major victim of such a mistake. Inexpensive energy is essential to environmental health. Prosperous people have the wealth to spare for environmental preservation and enhancement. Poor, impoverished people do not.
There are no experimental data to support the hypothesis that increases in human hydrocarbon use or in atmospheric carbon dioxide and other greenhouse gases are causing or can be expected to cause unfavorable changes in global temperatures, weather, or landscape. There is no reason to limit human production of CO2, CH4, and other minor greenhouse gases as has been proposed (82,83,97,123).
We also need not worry about environmental calamities even if the current natural warming trend continues. The Earth has been much warmer during the past 3,000 years without catastrophic effects. Warmer weather extends growing seasons and generally improves the habitability of colder regions.
As coal, oil, and natural gas are used to feed and lift from poverty vast numbers of people across the globe, more CO2 will be released into the atmosphere. This will help to maintain and improve the health, longevity, prosperity, and productivity of all people.
The United States and other countries need to produce more energy, not less. The most practical, economical, and environmentally sound methods available are hydrocarbon and nuclear technologies.
Human use of coal, oil, and natural gas has not harmfully warmed the Earth, and the extrapolation of current trends shows that it will not do so in the foreseeable future. The CO2 produced does, however, accelerate the growth rates of plants and also permits plants to grow in drier regions. Animal life, which depends upon plants, also flourishes, and the diversity of plant and animal life is increased.
Human activities are producing part of the rise in CO2 in the atmosphere. Mankind is moving the carbon in coal, oil, and natural gas from below ground to the atmosphere, where it is available for conversion into living things. We are living in an increasingly lush environment of plants and animals as a result of this CO2 increase. Our children will therefore enjoy an Earth with far more plant and animal life than that with which we now are blessed.
1. Robinson, A. B., Baliunas, S. L., Soon, W., and Robinson, Z. W. (1998) Journal of American Physicians and Surgeons 3, 171-178.
2. Soon, W., Baliunas, S. L., Robinson, A. B., and Robinson, Z. W. (1999) Climate Res. 13, 149-164.
3. Keigwin, L. D. (1996) Science 274, 1504-1508. ftp://ftp.ncdc.noaa.gov/pub/data/paleo/contributions_by_author/keigwin1996/
4. Oerlemanns, J. (2005) Science 308, 675-677.
5. Oerlemanns, J., Björnsson, H., Kuhn, M., Obleitner, F., Palsson, F., Smeets, C. J. P. P., Vugts, H. F., and De Wolde, J. (1999) Boundary-Layer Meteorology 92, 3-26.
6. Greuell, W. and Smeets, P. (2001) J. Geophysical Res. 106, 31717-31727.
7. Marland, G., Boden, T. A., and Andres, R. J. (2007) Global, Regional, and National CO2 Emissions. In Trends: A Compendium of Data on Global Change. Carbon Dioxide Information Analysis Center,Oak Ridge National Laboratory, U.S. Department of Energy, Oak Ridge, TN, USA, http://cdiac.ornl.gov/trends/emis/tre_glob.htm
8. Soon, W. (2005) Geophysical Research Letters 32, 2005GL023429.
9. Hoyt, D. V. and Schatten, K. H. (1993) J. Geophysical Res. 98, 18895-18906.
10. National Climatic Data Center, Global Surface Temperature Anomalies (2007)
http://www.ncdc.noaa.gov/oa/climate/research/anomalies/anomalies.html and NASA GISS
http://data.giss.nasa.gov/gistemp/graphs/Fig.D.txt.
11. Soon, W., Baliunas, S., Idso, C., Idso, S., and Legates, D. R. (2003) Energy & Env. 14, 233-296.
12. Idso, S. B. and Idso, C. D. (2007) Center for Study of Carbon Dioxide and Global Change http://www.co2science.org/scripts/CO2ScienceB2C/education/reports/hansen/hansencritique.jsp.
13. Groveman, B. S. and Landsberg, H. E. (1979) Geophysical Research Letters 6, 767-769.
14. Esper, J., Cook, E. R., and Schweingruber, F. H. (2002) Science 295, 2250-2253.
15. Tan, M., Hou, J., and Liu, T. (2004) Geophysical Research Letters 31, 2003GL019085.
16. Newton, A., Thunell, R., and Stott, L. (2006) Geophysical Research Letters 33, 2006GL027234.
17. Akasofu, S.-I. (2007) International Arctic Research Center, Univ. of Alaska, Fairbanks http://www.iarc.uaf.edu/highlights/2007/akasofu_3_07/Earth_recovering_from_LIA_R.pdf
18. Teller, E., Wood, L., and Hyde, R. (1997) 22nd International Seminar on Planetary Emergencies, Erice, Italy, Lawrence Livermore National Laboratory, UCRL-JC-128715, 1-18.
19. Soon, W. (2007) private communication.
20. U.S. National Climatic Data Center, U.S. Department of Commerce 2006 Climate Review. http://lwf.ncdc.noaa.gov/oa/climate/research/cag3/na.html
21. Landsea, C. W. (2007) EOS 88 No. 18, 197, 208.
22. Landsea, C. W., Nicholls, N., Gray, W. M., and Avila, L. A. (1996) Geophysical Research Letters 23, 1697-1700.
23. Goldenberg, S. B., Landsea, C. W., Mesta-Nuñez, A. M., and Gray, W. M. (2001) Science 293, 474-479.
24. Jevrejeva, S., Grinsted, A., Moore, J. C., and Holgate, S. (2006) J. Geophysical Res. 111, 2005JC003229. http://www.pol.ac.uk/psmsl/author_archive/jevrejeva_etal_gsl/
25. Leuliette, E. W., Nerem, R. S., and Mitchum, G. T. (2004) Marine Geodesy 27, No. 1-2, 79-94. http://sealevel.colorado.edu/
26. Lamb, H. H. (1982) Climate, History, and the Modern World, Methuen, New York.
27. Essex, C., McKitrick, R., and Andresen, B. (2007) J. Non-Equilibrium Therm. 32, 1-27.
28. Polyakov, I. V., Bekryaev, R. V., Alekseev, G. V., Bhatt, U. S., Colony, R. L., Johnson, M. A., Maskshtas, A. P., and Walsh, D. (2003) Journal of Climate 16, 2067-2077.
29. Christy, J. R., Norris, W. B., Spencer, R. W., and Hnilo, J. J. (2007) J. Geophysical Res. 112, 2005JD006881. http://vortex.nsstc.uah.edu/data/msu/t2lt/uahncdc.
30. Spencer, R. W. and Christy, J. R. (1992) Journal of Climate 5, 847-866.
31. Christy, J. R. (1995) Climatic Change 31, 455-474.
32. Zhu, P., Hack, J. J., Kiehl, J. T., and Bertherton, C. S. (2007) J. Geophysical Res., in press.
33. Balling, Jr., R. C. (1992) The Heated Debate, Pacific Research Institute.
34. Friis-Christensen, E. and Lassen, K. (1991) Science 254, 698-700.
35. Baliunas, S. and Soon, W. (1995) Astrophysical Journal 450, 896-901.
36. Neff, U., Burns, S. J., Mangini, A., Mudelsee, M., Fleitmann, D., and Matter, A. (2001) Nature
411, 290-293. 37. Jiang, H., Eiríksson, J., Schulz, M., Knudsen, K., and Seidenkrantz, M. (2005) Geology 33, 73-76.
38. Maasch, K. A., et. al. (2005) Geografiska Annaler 87A, 7-15.
39. Wang, Y., Cheng, H., Edwards, R. L., He, Y., Kong, X., An, Z., Wu, J., Kelly, M. J., Dykoski, C. A., and Li, X. (2005) Science 308, 854-857.
40. Baliunas, S. L. et. al. (1995) Astrophysical Journal 438, 269-287.
41. Fenton, L. K., Geissler, P. E., and Haberle, R. M. (2007) Nature 446, 646-649.
42. Marcus, P. S. (2004) Nature 428, 828-831.
43. Hammel, H. B., Lynch, D. K., Russell, R. W., Sitko, M. L., Bernstein, L. S., and Hewagama, T. (2006) Astrophysical Journal 644, 1326-1333.
44. Hammel, H. B., and Lockwood, G. W. (2007) Geophysical Research Letters 34, 2006GL028764.
45. Elliot, J. L., et. al. (1998) Nature 393, 765-767.
46. Elliot, J. L., et. al. (2003) Nature 424, 165-168.
47. Sicardy, B., et. al. (2003) Nature 424, 168-170.
48. Elliot, J. L., et. al. (2007) Astronomical Journal 134, 1-13.
49. Camp, C. D. and Tung, K. K. (2007) Geophysical Research Letters 34, 2007GL030207.
50. Scafetta, N. and West, B. J. (2006) Geophysical Research Letters 33, 2006GL027142.
51. Goodridge, J. D. (1996) Bull. Amer. Meteor. Soc. 77, 3-4; Goodridge, J. D. (1998) private comm.
52. Christy, J. R. and Goodridge, J. D. (1995) Atm. Envirn. 29, 1957-1961.
53. Hansen, J. and Lebedeff, S. (1987) J. Geophysical Res. 92, 13345-13372.
54. Hansen, J. and Lebedeff, S. (1988) Geophysical Research Letters 15, 323-326.
55. Hansen, J., Ruedy, R., and Sato, M. (1996) Geophysical Research Letters 23, 1665-1668; http://www.giss.nasa.gov/data/gistemp/
56. Schimel, D. S. (1995) Global Change Biology 1, 77-91.
57. Houghton, R. A. (2007) Annual Review of Earth and Planetary Sciences 35, 313-347.
58. Jaworowski, Z., Segalstad, T. V., and Ono, N. (1992) Science of the Total Environ. 114, 227-284.
59. Segalstad, T. V. (1998) Global Warming the Continuing Debate, Cambridge UK: European Science and Environment Forum, ed. R. Bate, 184-218.
60. Berner, R. A. (1997) Science 276, 544-545.
61. Retallack, G. J. (2001) Nature 411, 287-290.
62. Rothman, D. H. (2002) Proc. Natl. Acad. Sci. USA 99, 4167-4171.
63. Petit et. al., (1999) Nature 399, 429-436.
64. Siegenthaler, U., et. al. (2005) Science 310, 1313-1317.
65. Spahni, R., et. al. (2005) Science 310, 1317-1321.
66. Soon, W. (2007) Physical Geography, in press.
67. Dettinger, M. D. and Ghill, M. (1998) Tellus, 50B, 1-24.
68. Kuo, C., Lindberg, C. R., and Thornson, D. J. (1990) Nature 343, 709-714.
69. Revelle, R. and Suess, H. E. (1957) Tellus 9, 18-27.
70. Yamashita, E., Fujiwara, F., Liu, X., and Ohtaki, E. (1993) J. Oceanography 49, 559-569.
71. Keeling, C. D. and Whorf, T. P. (1997) Trends Online: A Compendium of Data on Global Change, Carbon Dioxide Information Analysis Center, Oak Ridge National Laboratory; http://cdiac.ornl.gov/trends/co2/sio-mlo.htm http://www.esrl.noaa.gov/gmd/ccgg/trends/co2_data_mlo.html
72. Schneider, D. P. et. al. (2006) Geophysical Research Letters 33, 2006GL027057.
73. Archer, D. (2005) J. Geophysical Res. 110, 2004JC002625.
74. Faraday, M. (1860) The Chemical History of a Candle, Christmas Lectures, Royal Institution, London.
75. Serreze, M. C., Holland, M. M., and Stroeve, J. (2007) Science 315, 1533-1536.
76. Bentley, C. R. (1997) Science 275, 1077-1078.
77. Nicholls, K. W. (1997) Nature 388, 460-462.
78. Davis, C. H., Li, Y., McConnell, J. R., Frey, M. M., and Hanna, E. (2005) Science 308, 1898-1901.
79. Monaghan, A. J., et. al. (2006) Science 313, 827-831.
80. Kullman, L. (2007) Nordic Journal of Botany 24, 445-467.
81. Lindzen, R. S. (1994) Ann. Review Fluid Mech. 26, 353-379.
82. IPCC Fourth Assessment Report (AR4), Working Group I Report (2007).
83. Kyoto Protocol to the United Nations Framework Convention on Climate Change (1997).
84. Sun, D. Z. and Lindzen, R. S. (1993) Ann. Geophysicae 11, 204-215.
85. Spencer, R. W. and Braswell, W. D. (1997) Bull. Amer. Meteorological Soc. 78, 1097-1106.
86. Idso, S. B. (1998) Climate Res. 10, 69-82.
87. Soon, W., Baliunas, S., Idso, S. B., Kondratyev, K. Ya., and Posmentier, E. S. (2001) Climate Res. 18, 259-275.
88. Lindzen, R. S. (1996) Climate Sensitivity of Radiative Perturbations: Physical Mechanisms and Their Validation, NATO ASI Series 134, ed. H. Le Treut, Berlin: Springer-Verlag, 51-66.
89. Renno, N. O., Emanuel, K. A., and Stone, P. H. (1994) J. Geophysical Res. 99, 14429-14441.
90. Soden, B. J. (2000) Journal of Climate 13, 538-549.
91. Lindzen, R. S., Chou, M., and Hou, A. Y. (2001) Bull. Amer. Meteorlogical Soc. 82, 417-432.
92. Spencer, R. W., Braswell, W. D., Christy, J. R., and Hnilo, J. (2007) Geophysical Research Letters 34, 2007GL029698.
93. Lindzen, R. S. (1995), personal communication.
94. Khalil, M. A. K., Butenhoff, C. L., and Rasmussen, R. A. (2007) Environmental Science and Technology 41, 2131-2137.
95. Annual Energy Review, U.S. Energy Information Admin., Report No. DOE/EIA-0384 (2006).
96. Essex, C., Ilie, S., and Corless, R. M. (2007) J. Geophysical Res., in press.
97. Gore, A. (2006) An Inconvenient Truth, Rodale, NY.
98. Penner, S S., Schneider, A. M., and Kennedy, E. M. (1984) Acta Astronautica 11, 345-348.
99. Crutzen, P. J. (2006) Climatic Change 77, 211-219.
100. Idso, S. B. (1989) Carbon Dioxide and Global Change: Earth in Transition, IBR Press.
101. Lam, S. H. (2007) Logarithmic Response and Climate Sensitivity of Atmospheric CO2, 1-15,
www.princeton.edu/~lam/documents/LamAug07bs.pdf.
102. Lindzen, R. S. (2005) Proc. 34th Int. Sem. Nuclear War and Planetary Emergencies, ed. R.
Raigaina, World Scientific Publishing, Singapore, 189-210.
103. Kimball, B. A. (1983) Agron. J. 75, 779-788.
104. Cure, J. D. and Acock, B. (1986) Agr. Forest Meteorol. 8, 127-145.
105. Mortensen, L. M. (1987) Sci. Hort. 33, 1-25.
106. Lawlor, D. W. and Mitchell, R. A. C. (1991) Plant, Cell, and Environ. 14, 807-818.
107. Drake, B. G. and Leadley, P. W. (1991) Plant, Cell, and Environ. 14, 853-860.
108. Gifford, R. M. (1992) Adv. Bioclim. 1, 24-58.
109. Poorter, H. (1993) Vegetatio 104-105, 77-97.
110. Graybill, D. A. and Idso, S. B. (1993) Global Biogeochem. Cyc. 7, 81-95.
111. Waddell, K. L., Oswald, D. D., and Powell D. S. (1987) Forest Statistics of the United States,
U.S. Forest Service and Dept. of Agriculture.
112. Smith, W. B., Miles, P. D., Vissage, J. S., and Pugh, S. A. (2002) Forest Resources of the
United States, U.S. Forest Service and Dept. of Agriculture.
113. Grace, J., Lloyd, J., McIntyre, J., Miranda, A. C., Meir, P., Miranda, H. S., Nobre, C., Moncrieff,
J., Massheder, J., Malhi, Y., Wright, I., and Gash, J. (1995) Science 270, 778-780.
114. Idso, K. E. and Idso, S. (1974) Agr. Forest Meteor. 69, 153-203.
115. Kimball, B.A., Pinter Jr., P. J., Hunsaker, D. J., Wall, G. W. G., LaMorte, R. L., Wechsung, G.,
Wechsung, F., and Kartschall, T. (1995) Global Change Biology 1, 429-442.
116. Pinter, J. P., Kimball, B. A., Garcia, R. L., Wall, G. W., Hunsaker, D. J., and LaMorte, R. L.
(1996) Carbon Dioxide and Terrestrial Ecosystems 215-250, Koch and Mooney, Acad. Press.
117. Idso, S. B. and Kimball, B. A. (1991) Agr. Forest Meteor. 55, 345-349.
118. Idso, S. B. and Kimball, B. A. (1994) J. Exper. Botany 45, 1669-1692.
119. Idso, S. B. and Kimball, B. A., (1997) Global Change Biol. 3, 89-96.
120. McNaughton, S. J., Oesterhold, M., Frank. D. A., and Williams, K. J. (1989) Nature 341,
142-144.
121. Cyr, H. and Pace, M. L. (1993) Nature 361, 148-150.
122. Scheiner, S. M. and Rey-Benayas, J. M. (1994) Evol. Ecol. 8, 331-347.
123. Gore, A., Pelosi, N., and Reid, H. (June 29, 2007) The Seven Point Live Earth Pledge. Speaker
of the House Website, www.speaker.gov. and www.liveearth.org.
124. Beckmann, P. (1985) The Health Hazards of NOT Going Nuclear, Golem, Boulder, Colorado.
125. American Nuclear Society, Nuclear News (2007) March, 46-48.
126. McNamara, B. (2006) Leabrook Computing, Bournemouth, England.
127. Projected Costs of Generating Electricity: 2005 Update (2005), Paris: Nuclear Energy Agency, OECD Publication No. 53955 2005, Paris.
128. Penner, S. S. (1998) Energy 23, 71-78.
129. Posma, B. (2007) Liquid Coal, Fort Meyers, Fl, www.liquidcoal.com.
130. Ausubel,. J. H. (2007) Int. J. Nuclear Governance, Economy and Ecology 1, 229-243.
131. Penner, S. S. (2006) Energy 31, 33-43.
132. Simon, J. L. (1996) The Ultimate Resource 2, Princeton Univ. Press, Princeton, New Jersey.


